Evaluating Edge AI Accelerator Performance: Why TOPS Are Not Enough

The recent requirement for efficient edge AI solutions across Smart City, Smart Retail, Surveillance and Automotive, has driven a boom in edge AI chips. Both established corporations and innovative startups have produced such offerings. When an edge AI solutions provider tries to evaluate the performance of the myriad chips available, he or she meets a single key metric: the tera operations per second, or TOPS. You do not have to look long before you encounter multiple such claims made by edge AI offerings. This is the way the market talks and we at Hailo are no exception, as our marketing and press releases show.
What Are TOPS In AI?
TOPS, in the way that the term is used here, is a measure of the maximum achievable AI performance of an AI accelerator or SoC. However, it is really a proxy for the physical properties of the device – the number of hardware Multiply-And-Accumulate (MAC) units implemented in the processor and the operating frequency. It can easily be calculated as follows:

(The constant 2 is added because each MAC performs two operations: Multiply and Accumulate).
The resulting number reflects the maximum achievable performance for a synthetic workload that does not realize any actual perception workload on the chip. Therefore, comparing AI accelerators based on this metric alone will not help uncover the performance KPIs that are interesting to the edge AI product designer – namely, throughput or latency.
AI Processor Benchmarking and TOPs Utilization
This fact has not gone unnoticed in the industry, and some efforts have been put into creating standardized benchmarks, the goal of which is to help distill the behavior of complex hardware-software systems into a single palatable number. Two notable efforts in this category are MLcommons’ MLperf™ and EEMBC’s MLMark™.
Generally, if we were to select a single industry-accepted benchmark, it would probably be the ResNet-50 classification benchmark. When we evaluate the performance of different solutions on the same benchmark, we can easily see that the correlation between TOPS and actual performance is existent but weak (See Figure 1).
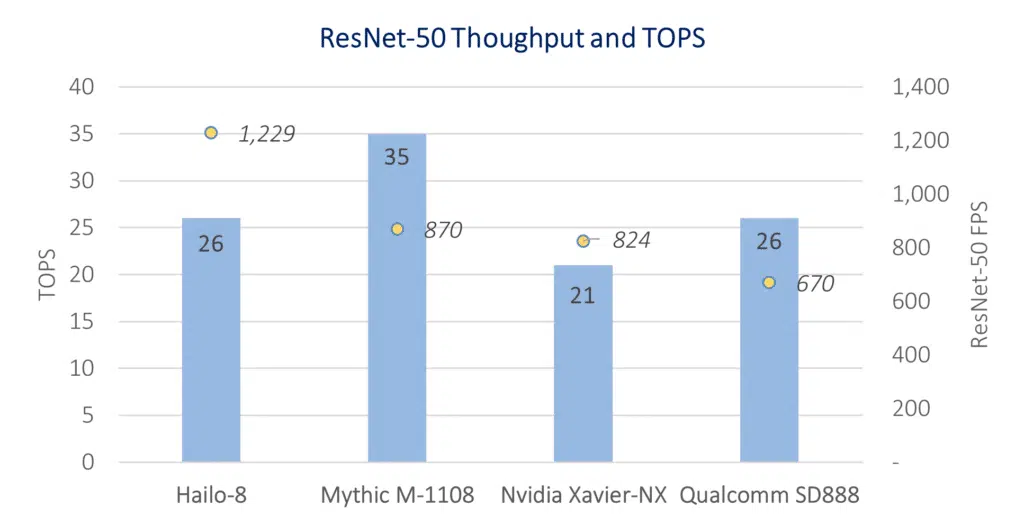
Figure 1: comparing TOPS and performance on the ResNet-50 benchmark for AI processors on the market. Performance figures are based on publicly available data from Hailo, Nvidia, Mythic and Qualcomm at batch 1, expect Nvidia published benchmark at batch size of 8 [1]
In addition, benchmark throughput figures may shed some light on the architecture behind the crude TOPS figure, specifically:
- MACs organization
- MACs to memory interconnect
- On-/off-chip memory bandwidth and control bottlenecks
The quality of the of the architecture can also be distilled to a single metric – MAC utilization, which measures how efficiently the MACs that are available in silicon are used for a specific workload and can be calculated as follows:

AI Benchmarking from an Edge AI Product Perspective
While ubiquitous, the ResNet-50 benchmark is not a good enough reference for the AI product designer. We should keep in mind that:
- ResNet-50 is a classification task, while target markets usually care about downstream tasks such as object detection, pose estimation, semantic/instance segmentation and so on.
- The ResNet-50 resolution is low and does not reflect activation data bandwidth bottlenecks that arise at higher resolutions used in practice.
- ResNet-50 is old news. The paper was released in 2014, and though popular, more recent advances in classification models architecture have significantly outpaced it at the same performance point (RegNets and EffcientNets are two examples).
And it is not just ResNet-50. We can find such obvious faults with other industry-standard benchmarks. To take another example, YOLOv3 – the object detection network that is the second most popular benchmark, may address the first two pain points but not the third. It was released in 2018 and has since been outperformed by EffcientDets in 2019. Those, in turn, were outperformed again by YOLOv4, and YOLOv5 in 2020, as Figure 2 shows.
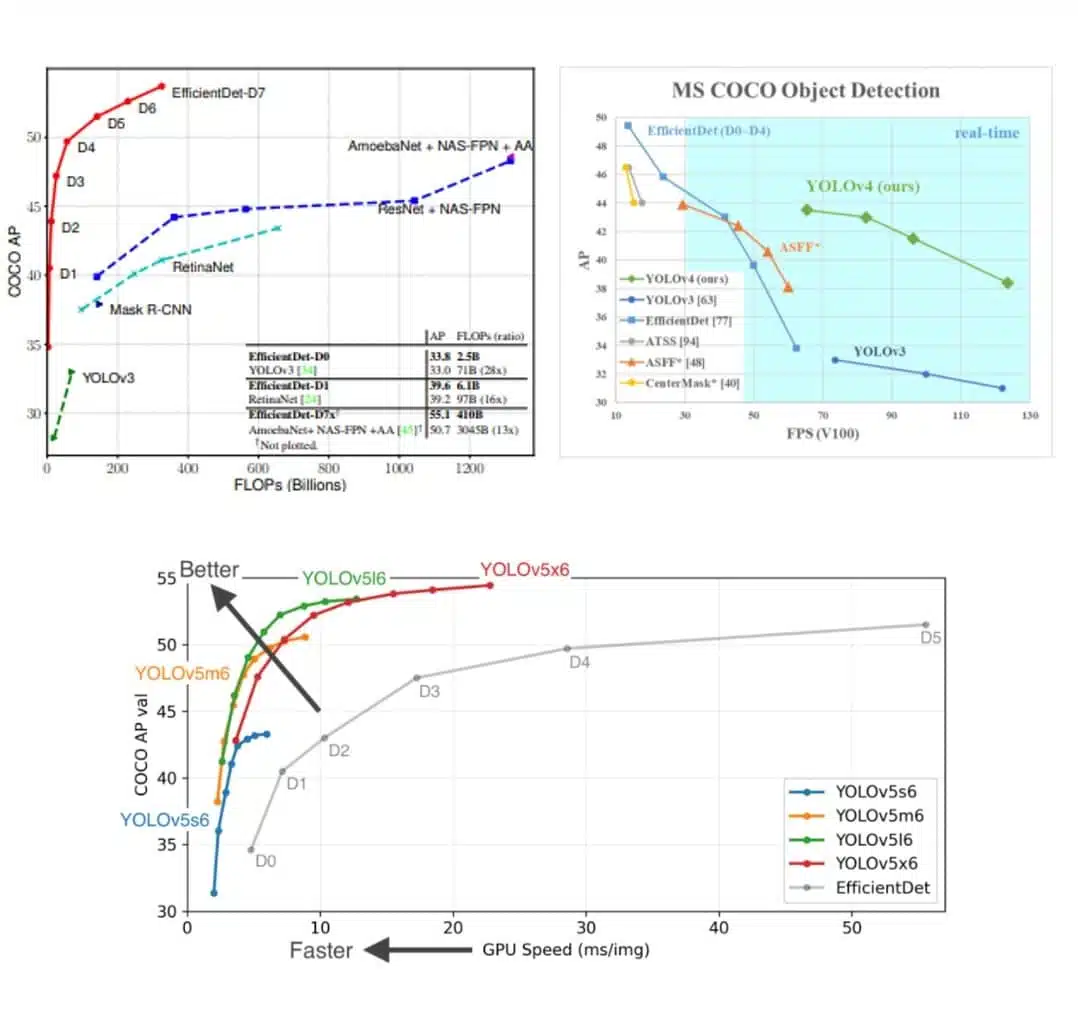
Figure 2: EfficienctDet has outperformed the very popular YOLOv3 and then surpassed by YOLOv4 and YOLOv5
Given the fast pace of improvements in network architectures, yielding higher accuracy for a given required throughput, perhaps the one-dimension benchmarking question should be reformulated to: “What is the highest throughput achievable given a required accuracy?”, or alternatively: “What is the achievable accuracy given a required throughput?”
Another way to put it and in the words of one of our customers: “I would like a 40-mAP object detector trained on the COCO dataset for a 6 cameras system running at 30 FPS. What can you do for me?”. This is a real-world question that can easily be answered by showing an accuracy/throughput graph for a requested task, where the end customer can evaluate the throughput-accuracy tradeoff:
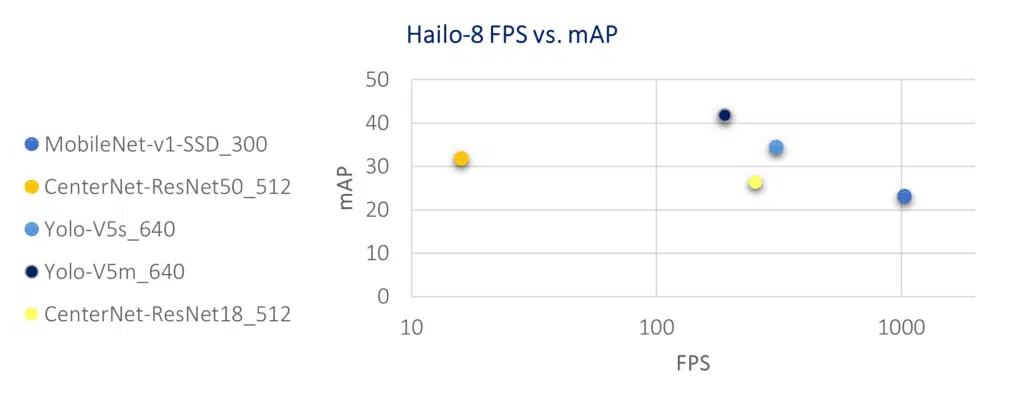
As the edge AI market is growing rapidly across products and market segments, claims are abundant and there is not an established industry ensemble of benchmarks that can predict actual AI processor performance in real-world use cases. In the meantime, the suggested method is be to look for the AI accelerator solution offering the best accuracy-throughput tradeoff.
To learn more about TOPS and benchmarks in evaluating edge AI accelerators performance, see my full talk at the recent Linley Spring Conference
Remarks and sources
[1] Benchmark figures for Nvidia, Mythic and Qualcomm are retrieved from:https://developer.nvidia.com/embedded/jetson-benchmarks
https://github.com/NVIDIA-AI-IOT/jetson_benchmarks/blob/master/benchmark_csv/nx-benchmarks.csv
https://www.linleygroup.com/newsletters/newsletter_detail.php?num=6243
https://www.qualcomm.com/media/documents/files/snapdragon-888-ai-presentation.pdf
Read mode about what we do
Hailo offers breakthrough AI accelerators and Vision processors


